Executive TL/DR
This capstone analyzes smart device usage data for Bellabeat, a women’s wellness technology company, to identify behavioral trends and translate them into actionable product and marketing recommendations. Using a structured data analyst framework (below), I combined quantitative analysis with contextual framing (personas, journeys, and lifecycle considerations) to move beyond descriptive statistics and toward product-relevant insights - culminating in the three recommendations you see below.
Framework used
Recommendations
Segmented Experiences
Tailor in-app content, insights, and notifications to distinct lifestyle and activity profiles (e.g., high-intensity achievers vs. casual trackers).
Time-Based Engagement
Deploy time-aware campaigns and nudges aligned to when users are most active—especially for subscription engagement.
Real-Time Feedback Loops
Extend live notifications and progress feedback through wearable integrations to reinforce goal completion and sustained engagement.
Additional Context & Sampling
In this exercise, our objective was to leverage quantitative fitness usage data and transform it into actionable insight, by contextualizing the data thorugh personas and behavior framing, applying a structured analytical workflow, and producing product & marketing recommendations grounded in observed user behavior. The output was an executive style presentation that would be shared with, or distributed to, stakeholders to accelerate alignment and ultimately action product feature evolution. See below for a sampling of the executive presentation, of which you can download in full at the link below.
 Figure 1: High-level framing for enhancing Bellabeat marketing strategies via user data.
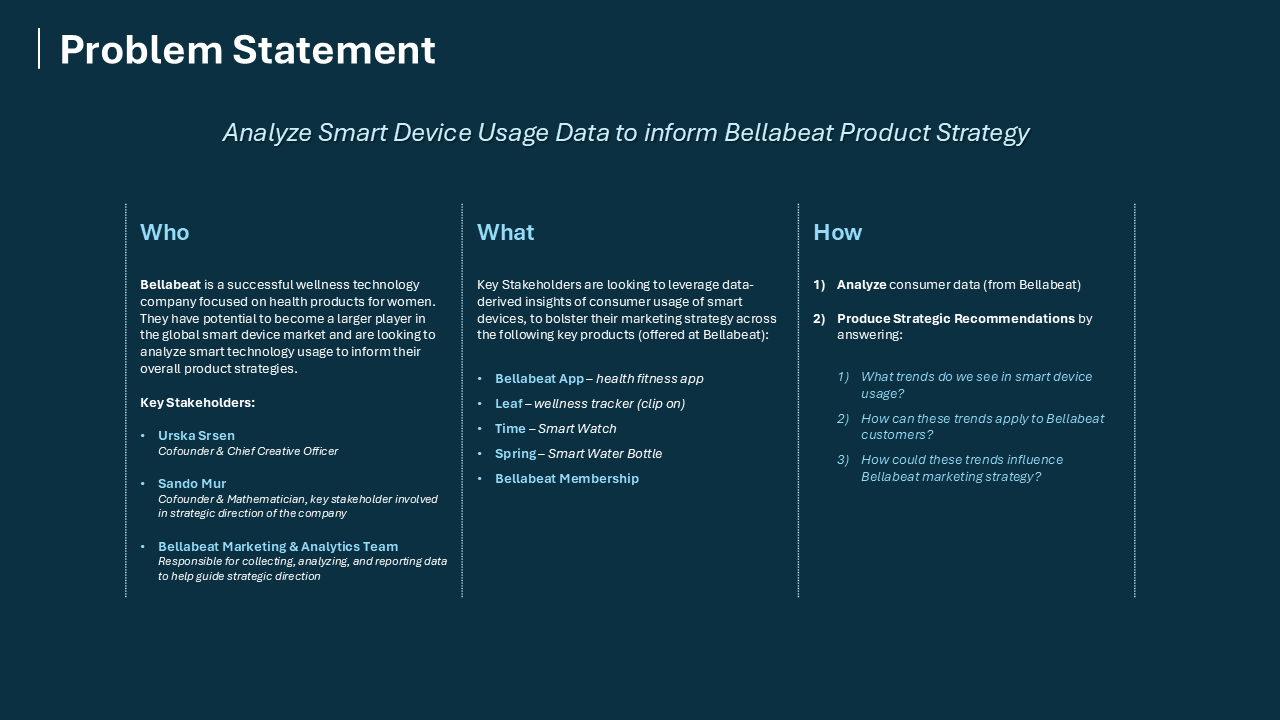 Figure 2: Defining the business problem and success criteria to anchor the technical analysis.
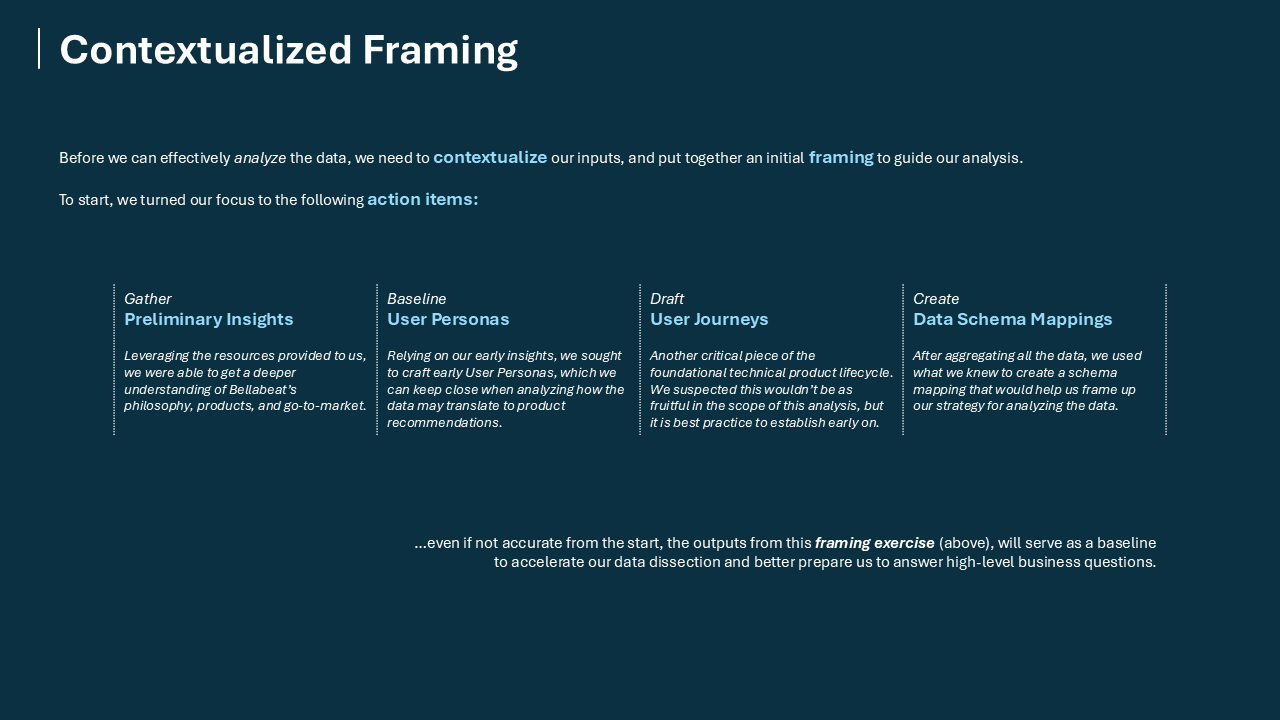 Figure 3: Mapping data schemas and preliminary behavioral flows.
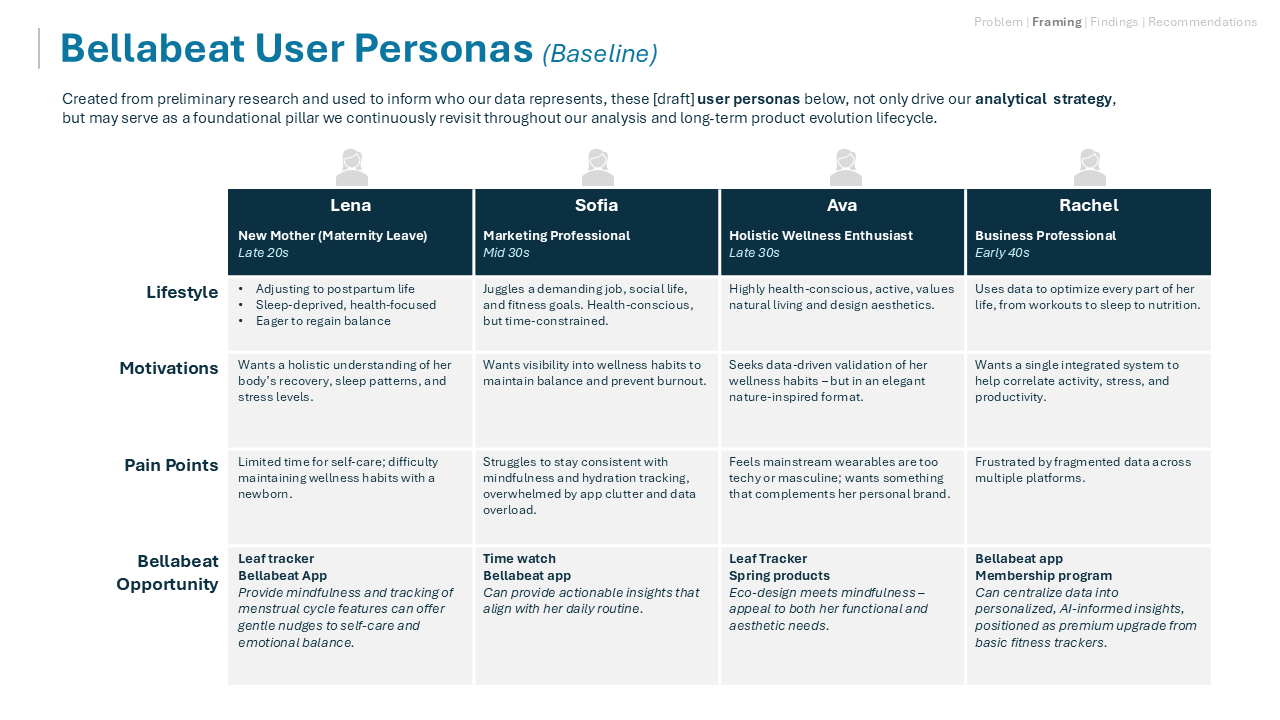 Figure 4: Baseline personas used to translate quantitative trends into human-centric lifestyle segments.
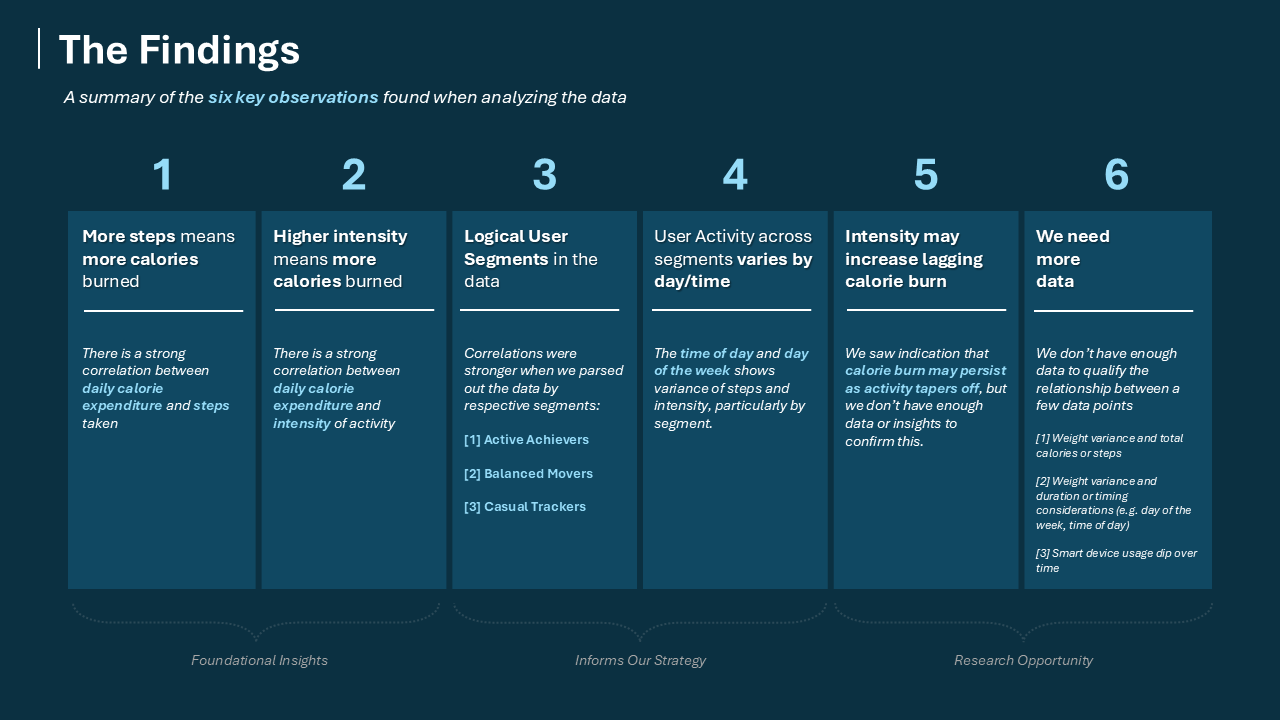 Figure 5: Synthesis of core observations, highlighting the relationship between intensity, duration, and engagement.
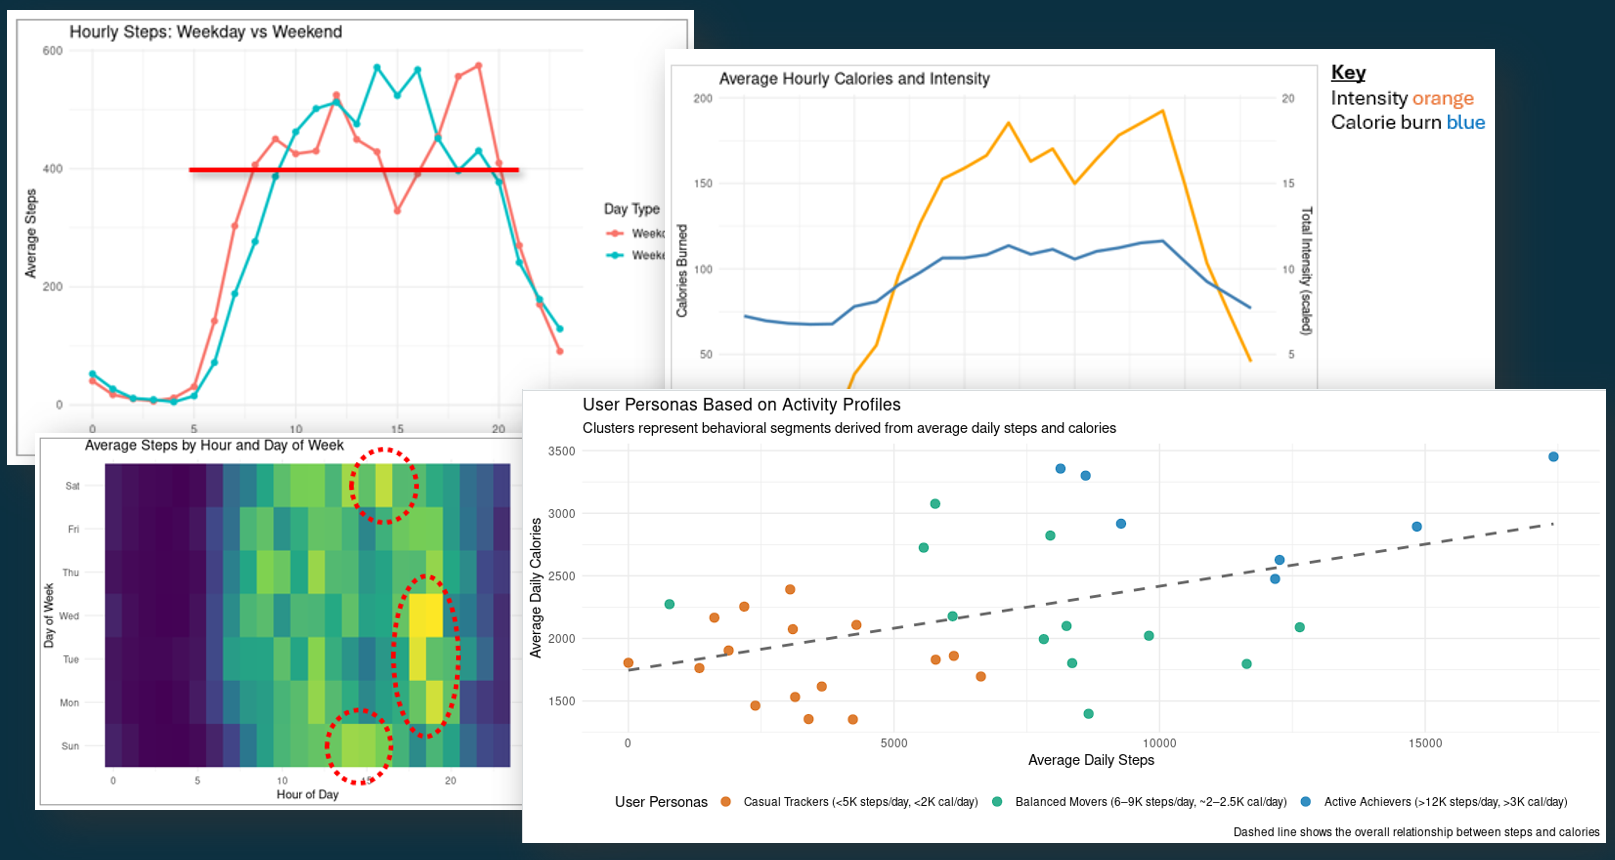 Figure 6: Deep dive into temporal usage patterns and step-count distributions.
Full Executive Briefing & Sample Slideware
Feel free to download the comprehensive presentation below, which includes the technical methodology, SQL queries, and expanded information around findings: